Non-intrusive debugging with ETM trace
Embedded Trace Macrocell (ETM) traces every single executed instruction in an application and provides you with unmatched insight into the microcontroller’s activities. In this text, I will describe what the ETM technology can do and guide you through a complete example application that shows how ETM trace can be of essential help to you.
ETM trace is a high-speed trace and offers a powerful debug mode that helps you get down to the most difficult problems. One of the greatest features of ETM trace is that it is non-intrusive. This means that it is possible to trace all instructions in the core without affecting the execution of your system. Code coverage, Optimization and Debugging are areas where ETM trace will give you deep insight into your code and how to optimize it. This will save both money and time. To use ETM, you need a special trace debug probe that can store the instructions in its memory, like IAR Systems’ I-jet Trace. I-jet Trace provides extensive trace features together with IAR Embedded Workbench and is available in several different versions to match different needs.
In the following example, I will guide you through a scenario where a LED is not blinking when it is supposed to blink. This small, but complete, example application shows how ETM trace can be of essential help to you in finding those strange hard-to-find bugs that are difficult or even impossible to find any other way.
Before we continue you should be aware of a few pre-requisites. To use ETM trace, the target board must have an ARM Cortex device with ETM available (for example in the ARM Cortex-M3 core, ETM is an optional component). Also, the ETM trace pins on the ARM Cortex device must be connected with the debug connector on the board. This is not always the case on all evaluation boards.
Hard-to-find bug scenario
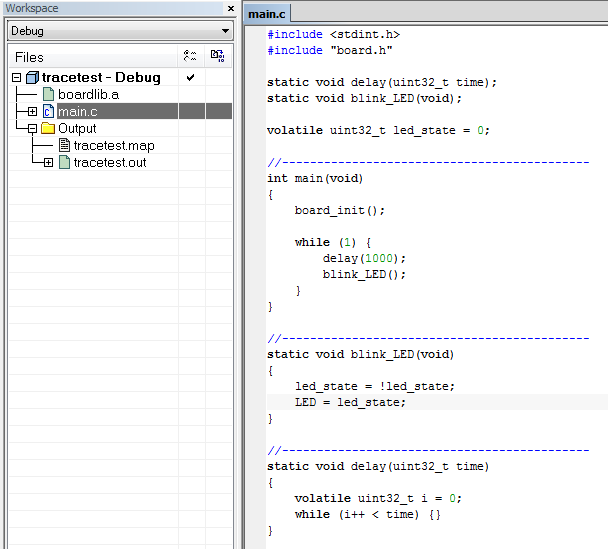
In this example application, a LED is blinked periodically in the blink_LED function. The variable led_state holds the LED state, and it toggles between 1 and 0. See the following screenshot from the project:

This very simple application should "just work", but when executed on the target device, the LED only blinks for about 30 seconds, then the LED switches off.
Examining the source code in main.c gives no clue on what might be the problem. Possibly, there is something in the board_init function that makes the application malfunction, but this function comes from the board support library (boardlib.a), and let’s imagine that this is a huge and complex library.
To investigate the problem further, ETM trace can help. When you have connected the I-jet Trace probe to your board and start debugging, look out for messages similar to these in the Debug Log window:
Probe: I-jet-Trace-ARM detected.
Probe: Opened in USB 3.0 mode
Probe: I-jet-Trace, FW ver 2.5 (2016/08/25, USB 2016/01/25), HW Ver:B
Probe: USB reading speed 384.0 MB/sec Data verified.
Download completed and verification successful.
Trace: ETMv3CM powered-up OK (ETMCR=0xc10)
Trace: Configured to collect ETM trace via MIPI-20 connector, 256MB trace memory used
Trace: Calibration [4-bit,tclk=90.00MHz,auto]: OK=#0, pattern=+++++++++++++++++++++++++++++++C+++++++++++++++++++++++++++++++
Trace: ETM read and validated (256B in 2ms - total 256B kept)
The log message above indicates that the probe connection is using high-speed USB 3 mode (in this case 384 MB/second). It also says that Flash download completed and has been verified. The Trace: Calibration line shows that the probe successfully detected a 90 MHz ETM clock.
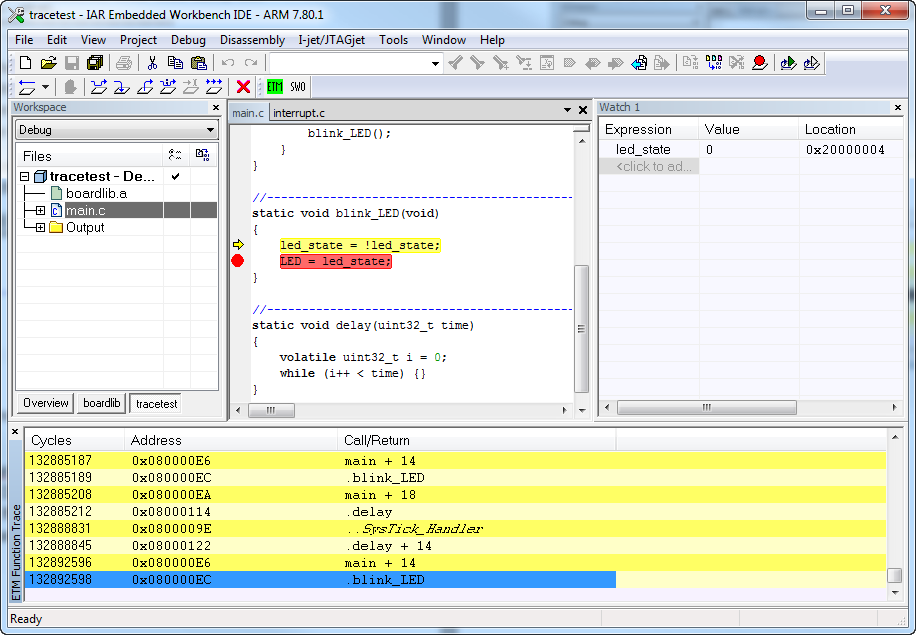
After this, simply let the application run until the LED stops blinking. When this happens, set a breakpoint in the blink_LED function:

When the breakpoint is triggered, the Watch window shows that led_state is (always) 0, just as expected. Why is this?
To find out, we can open the I-jet > Function Trace window to see what has happened previously in the application. Double-click in the Function Trace window to enable browse mode. In browse mode, the window turns yellow, and you can use your keyboard’s arrow buttons to step back and forward:

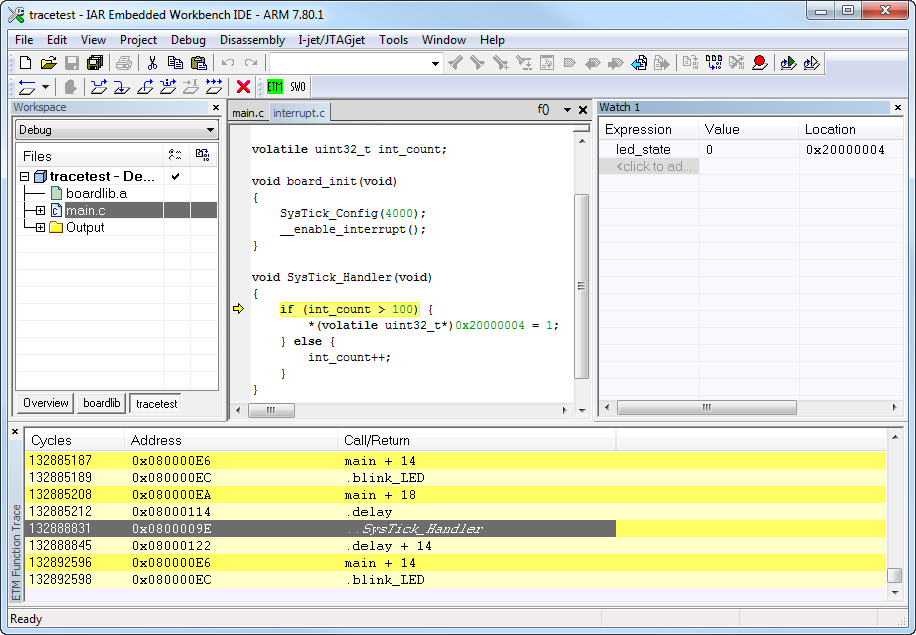
Stepping a few steps backwards in the trace data takes us to a function we haven’t seen before: the SysTick_Handler function:

And here we find the explanation! For some reason, the system tick interrupt handler function is configured to execute periodically, and after a number of ticks (about 30 seconds), it will write an integer value to address 0x20000004. This is the address to our led_state variable. This means that the value of our led_state variable is overwritten periodically by the system tick interrupt handler, and the LED will not blink.
Obviously, this example is only an illustration of a real-world problem, but it shows how trace can be a really useful tool in finding strange bugs in your application code.