Introduction to debugging with C-SPY macros
C-SPY, the debugger of IAR Embedded Workbench, includes a comprehensive macro system that lets you automate the debugging process and simulate peripheral devices. Macros can be used in conjunction with complex breakpoints and interrupt simulation to perform a wide variety of tasks, such as reading from and writing to target memory or to files on the host PC, resets, string operations and JTAG commands.
In this article, we will describe the basics of macros, and then show you an example of how to use macros.
C-SPY macro language syntax
The syntax of the macro language is actually very similar to the C language. There are:
- Macro statements, which are similar to C statements.
- Macro functions, which you can define with or without parameters and return values.
- Predefined built-in system macros, similar to C library functions, which perform useful tasks such as opening and closing files, setting breakpoints, and defining simulated interrupts.
- Macro variables, which can be global or local, and can be used in C-SPY expressions.
- Macro strings, which you can manipulate using predefined system macros.
Using macros
C-SPY macros can be called at specific times or executed manually or by breakpoints.
Setup macros
A setup macro is a macro with a predefined name that is called during a predefined phase of the debugging, such as each time the target is reset. These macros can be used for preparing the device before the next step in debugging, such as clearing or filling an area of the memory before downloading your application software.
One example where this might be useful is a system where the boot process is not developed yet, but you need to have some specific data in place for the application to work correctly. Instead of waiting for the developers working on the boot application so that you can test your application, just throw in a macro that loads the memory, perhaps from a file, before the application is loaded and continue testing, without changing the code to be tested.
Executing macros
A macro can be executed at other times too, either manually or by using a breakpoint. This breakpoint can be set by another macro depending on the conditions when executing this macro. This is really useful when debugging an event-driven system where you wish to debug a nested series of events, but want the system to keep running until this happens. As an example, you can have a system with two timer interrupts, one at 10s and one at 0.1s. Imagine that you want to know what happens the first time that the faster event triggers after the slower has triggered twice. You set a breakpoint in the slow event. This breakpoint calls a macro that checks whether it is the second time it has been called. If so, the macro sets a breakpoint in the faster event.
Below is one possible solution for that macro. It contains a counter as a macro variable, which is incremented every time the slow timer is executed. Once that counter is 2, the macro sets a code breakpoint at the entry of the fast timer interrupt handler:
SetBreakpoint(){
    if (SlowInterruptCount++ == 2)
    {
       brk = __setCodeBreak("Fast_Interrupt_Handler", 0, "1", "TRUE", "");

    }
}
Example of how to use macros
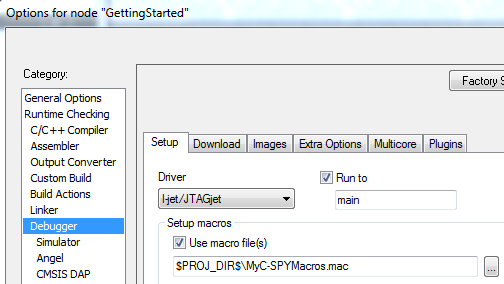
Before you can use a C-SPY macro in the debugger session, it has to be registered. The easiest way is to add the text file(s) with the definition of the C-SPY macros through the debugger project option:

The following setup macro function is executed once the debugger is started and will write a message to the debug log window, call MySetupMacro and open a file for writing:
execUserSetup(){/* Write a message to the debug log  */
__message "Debugger started\n";

MySetupMacro();

/* Opens a text file for ASCII writing */
_fileHandle = __openFile("$PROJ_DIR$\\Memory.txt", "w");
}
You could also use this setup macro function to perform some hardware initialization before the application is actually loaded. There are similar setup macro functions that are executed when the target is reset (execUserExit ), the execution is started or stopped (execUserStarted/Stopped) or when the debug session is ended (execUserExit).
C-SPY macros can also be called manually from the Macro Quicklaunch window or associated with a breakpoint. For instance, you might want to dump some memory to a file when you hit a code breakpoint:
WriteMemory2File()
{
   __var byte,address,_fileHandle;

   _fileHandle = __openFile("$PROJ_DIR$\\Memory.txt", "w");

  for (address=0x20000000;address< 0x2000FFFF;address++)
  {
        byte=__readMemoryByte(address,"Memory");
        __writeFile( _fileHandle, byte );
  }
   __closeFile( _fileHandle );

}
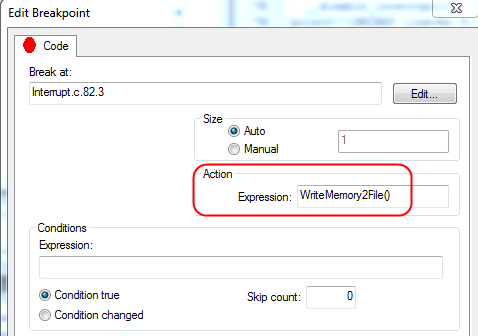
You can add this macro as an action expression to a code breakpoint:

If you prefer that the target is not halted at the breakpoint but continues running immediately after the memory dump, you can call the C-SPY macro as Condition rather than as Action.
Finally, you might want to do this memory dump while the C-SPY Debugger is running from command line (CSPYBAT) rather than within the IAR Embedded Workbench IDE. But how do you set and edit the breakpoint in this case? This is no problem at all, since C-SPY also offers system macros to set up breakpoints:
execUserSetup(){
...
/* __setCodeBreak(location, count, condition, cond_type, action) */
  __setCodeBreak("{myfile.c}.82.1",0,"WriteMemory2File()","TRUE","");
           ...
}
Conclusion
Whether you are connected to the target hardware or simulating your embedded project, C-SPY macros offer a very useful and flexible way to customize your debugging session. Possible usage scenarios include for example preparation of hardware for debugging, collection of various information while debugging or simulating peripherals and interrupts. You can find a complete overview of the available macros in the C-SPY Debugging Guide available in IAR Embedded Workbench.